The LUT Editor is designed for general or selective tonal correction and creating or editing color tables (CLUTs), which can be used in the Color Lookup (3D LUT) adjustment and adjustment layer.
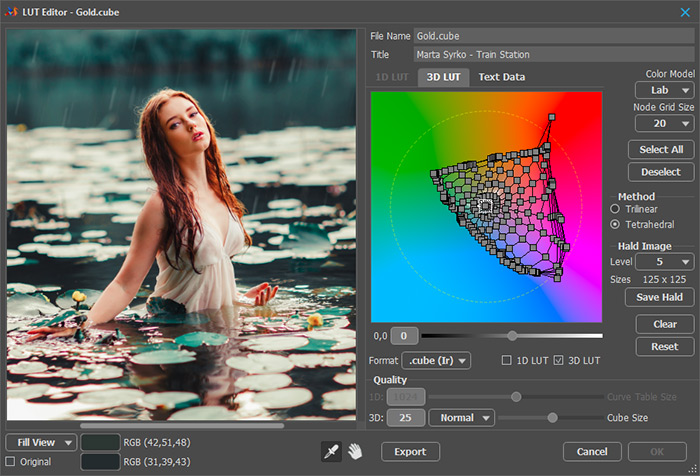 LUT Editor
In the left side of the dialog box, there is an image preview where all the changes are displayed.
In the drop-down menu, you can select the preview scale.
When you enable the Original check-box, the original image will be shown in the preview window.
Using the Eyedropper tool  , you can select a color from the image for editing in the 3D LUT tab. When you click within the preview image, a grid node closest to the specified color will be selected.
The color fields indicate the original color at a point (upper) and the modified color (lower) with coordinates in RGB space.
Using the Hand  , you can scroll the image in the preview window.
In the right part of the dialog box, there are options for creating and editing color tables.
In the File Name field, enter a short file name.
In the Title field (optional), enter a meaningful name that describes the effect being produced.
Select file format:
.3dl – can store 1D and 3D, but the 1D table is the same for all R, G, B channels;
.cube (Ir) – IRIDAS/Adobe LUT, can store either 1D or 3D;
.cube (Re) – DaVinci Resolve LUT, can store 1D and 3D.
There are two stages of color correction - 1D and 3D, which are applied sequentially, that is, the result of the 1D correction is fed to the 3D correction input.
Set Quality separately for 1D and 3D:
1D - the Curve Table Size in the range from 9 to 4096;
3D - the Cube Size (size of a cube side) in the range from 2 to 256.
The 1D data is represented by three tables of numbers (channel values) corresponding to the channels R, G, B. Editing the 1D data is carried out in the 1D LUT tab using curves. For 1D LUT, the linear interpolation is used.
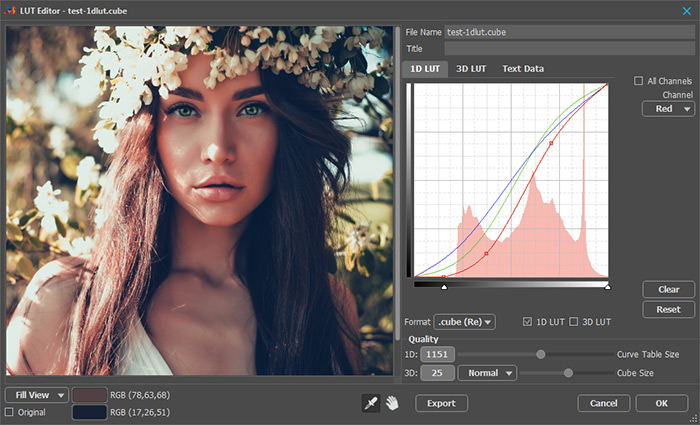 1D LUT Tab
When the All Channels check-box is enabled, the curve changes simultaneously for all channels. If the check-box is disabled, the curve can be changed individually for each channel.
Clicking the Clear button will reset the curve to its default value.
When you click the Reset button, the curve will be returned to its original form (as it was when you launched the LUT Editor).
3D data is a table of triplets of numbers (R, G, B values) in a 3D cube. Editing 3D data is carried out in the 3D LUT tab by shifting grid nodes from their initial position.
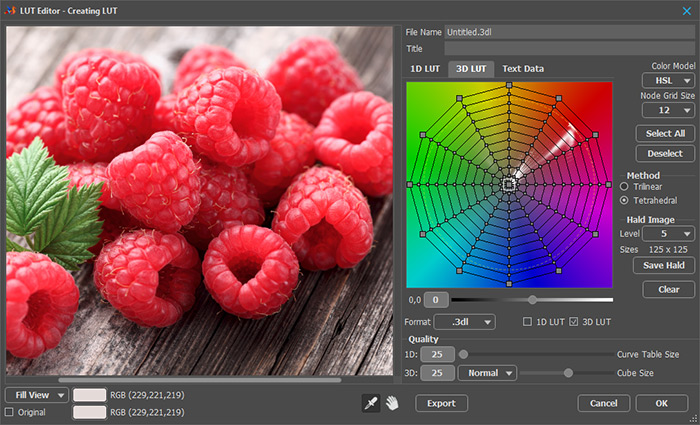 3D LUT Tab
The central part of the window is occupied by a color gradient field with a grid. It is a set of points that can be moved from the starting position. The grid nodes are located in a cylindrical space, corresponding in meaning to the HSL (Hue, Saturation, Lightness) space.
The number of grid nodes is determined by the Node Grid Size parameter.
Attention! When changing the grid size, all nodes will be reset to their original state.
Grid nodes can be free (small marker) or locked (large marker). A locked node maintains its position and brightness regardless of the movement and brightness of its neighbors.
Click the node to select and lock it. Adjust the brightness of the selected node using the slider located under the grid. Select multiple nodes by holding down the Ctrl key.
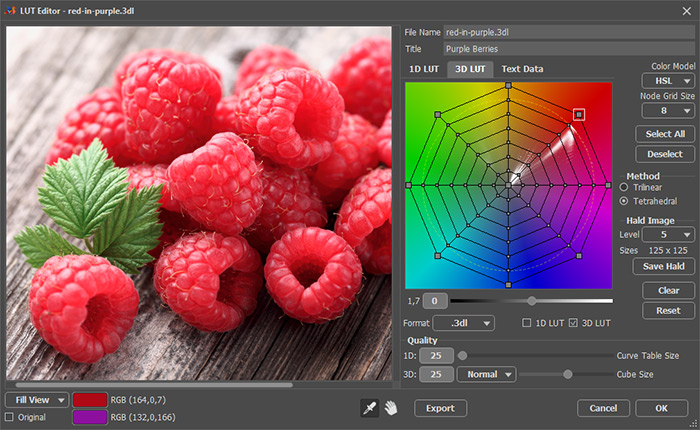 Original Grid and Image
Shifting a grid node from the initial position, you can replace the initial hue with the one specified by the current position of the grid node.
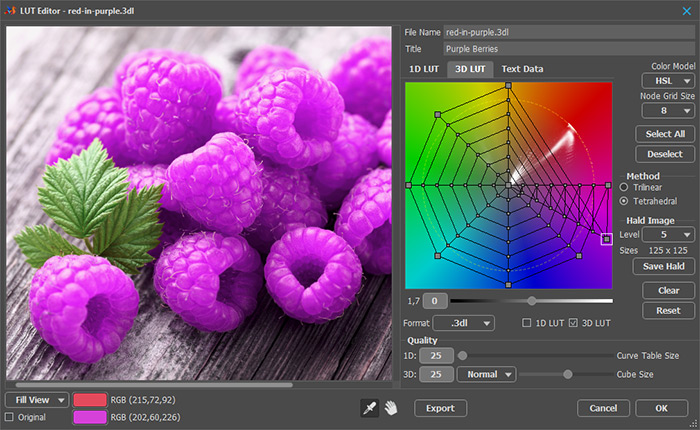 Modified Grid and Image
When you right-click the changed node, the state will return to the initial state, the brightness and locking will be reset. If several nodes are selected, they will all return to their original state.
Select All - selects all grid nodes.
Deselect - if several nodes are selected, it will be canceled for all but one.
Color Model is a mathematical model for representing color in the coordinates of the working cylindrical space.
You can choose from the models: HSL (Hue, Saturation, Lightness), HCY (Hue, Chroma, Luma), Lab, YUV.
The choice of model depends on the original image and the task at hand. Choose a model which will not create contours, halos, and other defects in the result.
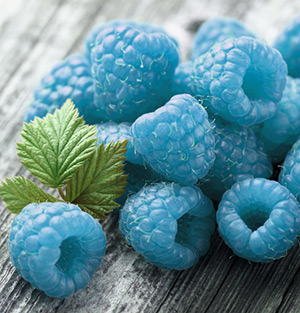 HSL
HSL
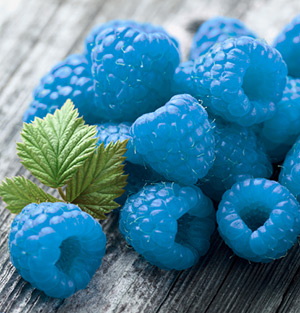 Lab
Lab
Interpolation Method – calculating an intermediate value for a smooth transition from one table cell to another with a fractional argument. You can choose either Trilinear or Tetrahedral method.
Hald Image is a visual representation of a 3D LUT. It is a flat square image containing all the colors of the cube in sequence when the R component changes first, then G and then B.
Level – a number from 2 to 16 that matches the sizes of the cube and square.
Save Hald - when you click the button, the image will be saved to disk as a PNG file.
Click the Clear button to reset the grid to its default value.
Click the Reset button to return the grid to its original form (as it was when you launched the LUT Editor).
In the Text Data tab, you can add a comment and indicate copyright.
Click the Export button to save the configured lookup table to disk.
Click OK to add the configured lookup table to the LUT list in the Color Lookup (3D LUT) adjustment.
Click Cancel to close the dialog box without accepting the changes.
